1. Overview
I conducted a solo stakeholder mapping project to understand how urban infrastructure—specifically deteriorating crosswalks—is maintained, repaired, and managed. The focus was on visualizing relationships between infrastructure, programs, and governing bodies in Ann Arbor, while exploring the role of digital tools in enabling accessible and equitable access.
2. Context / Problem
Urban infrastructure often appears straightforward to users—e.g., “a crosswalk needs repair”—but the underlying networks of responsibility, programs, and environmental factors are complex. I aimed to explore:
- Who is involved in maintaining or repairing infrastructure?
- How do environmental conditions affect stakeholders’ ability to act or respond?
- What role can digital tools play in improving accessibility and communication?
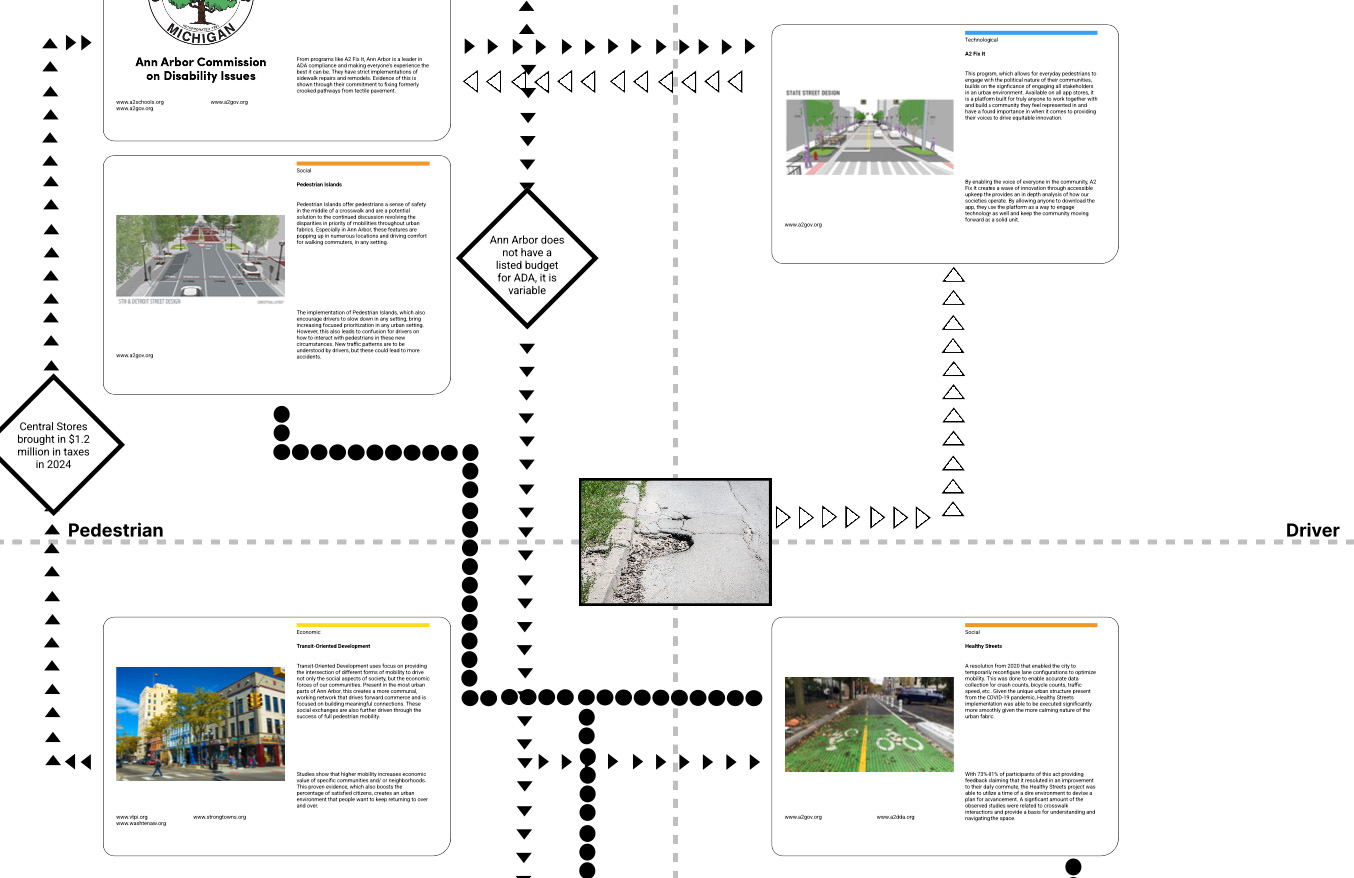
By investigating a deteriorating crosswalk in Ann Arbor, I sought to uncover systemic relationships and identify gaps in communication or responsibility that impact pedestrian access and safety.
3. Research & Insights
Conducted background research on municipal programs, public works, and governing bodies responsible for infrastructure maintenance in Ann Arbor.
Explored the significance of digital reporting tools, accessibility maps, and public feedback mechanisms in facilitating repairs and engagement. Observed that environmental conditions—weather, traffic patterns, surrounding land use—affect how stakeholders prioritize or execute repairs.
- Stakeholders are interdependent: city agencies, community members, and contractors all influence outcomes.
- Digital tools can bridge gaps, making reporting and communication more transparent and actionable.
- A seemingly simple problem, like a damaged crosswalk, reflects broader systemic patterns and relationships.
4. Ideation
Sketched preliminary relationship diagrams connecting infrastructure elements, programs, government agencies, and community stakeholders.
Considered how environmental conditions (season, pedestrian usage, adjacent infrastructure) impact each stakeholder.
Decided to visualize these relationships in a layered stakeholder map showing dependencies, responsibilities, and interaction pathways.
5. Design & Prototyping
Created the final stakeholder map in Figma, using a clear hierarchy and color-coding to distinguish stakeholder types (city agencies, community organizations, digital tools, environmental factors).
Design Rationale
- Readability and accessibility: semantic groupings, consistent typography, clear labels, sufficient white space.
- Interactive elements: clickable nodes for detailed information to make the map engaging.
- Visual communication: highlights points where digital tools could facilitate better communication and quicker maintenance.
6. Testing & Iteration
Reviewed the map with peers and mentors to ensure clarity, accuracy, and interpretability.
Iterations included refining labeling, simplifying complex connections, and enhancing visual cues for critical stakeholders and environmental factors.
Resulting map was more intuitive for viewers unfamiliar with municipal processes, allowing them to trace responsibility pathways and identify potential gaps in maintenance workflows.
7. Outcome / Impact
Delivered a comprehensive stakeholder map illustrating interconnections between infrastructure, programs, governing bodies, and environmental conditions.
Highlighted the importance of digital tools in improving accessibility and transparency in urban repair processes.
The project strengthened my ability to visualize complex systems, synthesize research into actionable insights, and communicate systemic relationships clearly and engagingly.
The interactive, layered approach provides a resource for designers, city planners, and community advocates seeking to improve urban infrastructure management.
8. Reflection
What I learned: Even simple urban issues reveal complex systemic relationships when examined carefully. Mapping stakeholders encourages thinking beyond surface-level problems and fosters insight into structural and procedural dynamics.
If revisiting the project: incorporate real-time data on infrastructure conditions, usage patterns, and repair timelines to create a dynamic, living stakeholder map. Explore integrating geospatial tools for enhanced environmental context.
I’m proud of expanding my perspective on research methods, stakeholder analysis, and the power of visualization in communicating urban systems. It taught me to consider not only the users but the entire network of actors and conditions that influence outcomes.